Tutorial
This tutorial assumes that you are familiar with Python as well as with GMT. If not, to avoid frustration, you may first want to dive into the Python tutorial or the GMT tutorial.
Example 1: Basic usage
The most basic usage of GmtPy is to use it as a replacement for plain GMT shell scripts.
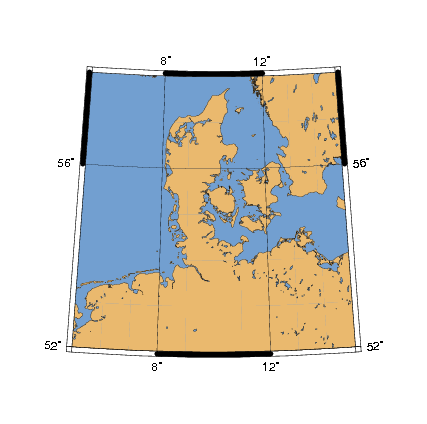
Here is a simple shell script producing the map above with a single call to pscoast (man), which we would then like to translate into a Python script.
Shell script version
#!/bin/bash
gmtset BASEMAP_TYPE = fancy \
       PAPER_MEDIA = a4+ \
       PAGE_ORIENTATION = portrait

pscoast -R5/15/52/58 \
        -JB10/55/55/60/10c \
        -B4g4 \
        -Df \
        -S114/159/207 \
        -G233/185/110 \
        -Wthinnest > example1.eps

epstopdf --outfile=example1.pdf example1.eps
Python version
# gmtpy's GMT class is used for GMT plotting:

from gmtpy import GMT


# For each graphics file to be produced, create a GMT instance.
# The keyword argument `config`, takes a dict with gmtdefaults
# variables you wish to override.

gmt = GMT( config={'BASEMAP_TYPE':'fancy'} )


# Every GMT command is now accessible as a method to the GMT instance:

gmt.pscoast( R='5/15/52/58',       # region
             J='B10/55/55/60/10c', # projection
             B='4g4',              # grid
             D='f',                # resolution
             S=(114,159,207),      # wet fill color
             G=(233,185,110),      # dry fill color
             W='thinnest' )        # shoreline pen


# The PostScript output of the GMT commands is accumulated in memory,
# until the save method is called:

gmt.save('example1.pdf')  # save() looks at the filename extension
gmt.save('example1.eps')  # to determine what format should be saved.
Python version without the comments
from gmtpy import GMT

gmt = GMT( config={'BASEMAP_TYPE':'fancy'} )

gmt.pscoast( R='5/15/52/58',
             J='B10/55/55/60/10c',
             B='4g4',
             D='f',
             S=(114,159,207),
             G=(233,185,110),
             W='thinnest' )

gmt.save('example1.pdf')
gmt.save('example1.eps')
How GmtPy handles gmtdefaults variables
GmtPy uses its own consistent built-in set of gmtdefaults parameters, such that running a GmtPy script on a different machine, or from a different user account should not change the appearance of the output graphics.
The keyword argument config of GMT takes a dict with all the gmtdefaults (man) variables which you want to override.
The defaults are selected with the hypothetical default goal of producing graphics to be included in publications or presentations. In particular, EPS output (PAPER_MEDIA = a4+) and portrait page orientation (PAGE_ORIENTATION = portrait) are selected as defaults. You can get the complete list of defaults with:
import gmtpy
print gmtpy.gmtdefaults_as_text()
The gmtset (man) utility should not be used with GmtPy.
GmtPy ignores any .gmtdefaults files.
How method arguments are turned into command line arguments by GmtPy
- When GMT programs are run via methods of the GMT object, any keyword arguments are translated into option arguments for the GMT program.
- Any non-keyword arguments are also handed over to the GMT program. So writing '-Df' is equivalent to writing D='f'
- Numbers and everything else (except tuples and boolean values, see below and example 2) which is given as a keyword argument is turned into a string using Python’s str() function before being passed to the GMT command. So writing S=100.5 is equivalent to writing S='100.5'.
- Tuples in the keyword arguments like (114,159,207) are translated into slash-separated strings like '144/159/207' by GmtPy.
- See documentation of GMT.__getattr__() for details
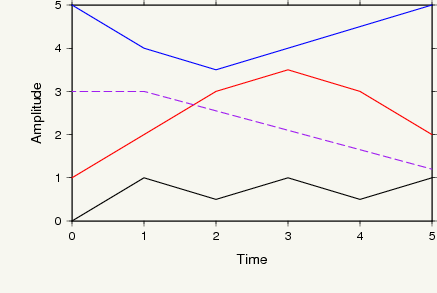
Example 2: How to get data from Python into GMT
This example illustrates the use of different methods to pipe data to the GMT programs.
Python code
from gmtpy import GMT

gmt = GMT( config={'PAGE_COLOR':'247/247/240'} )
gmt.psbasemap( R=(0,5,0,5),
               J='X%gi/%gi' % (5,3),
               B='%g:Time:/%g:Amplitude:SWne' % (1,1) )


# Make four different datasets

# (1) a nested list, with the first dim corresponding to columns
data_as_columns = [ [ 0,1,2,3,4,5 ], [0,1,0.5,1,0.5,1] ]

# (2) a nested list, with the first dim corresponding to rows
data_as_rows = [ [0,1], [1,2], [2,3], [3,3.5], [4,3], [5,2] ]

# (3) a string containing an ascii table
data_as_string = '''0 5
1 4
2 3.5
3 4
4 4.5
5 5'''


# (4) write ascii table in a temporary file...

# Get a filename in the private tempdir of the GMT instance.
# Files in that directory get deleted automatically.
filename = gmt.tempfilename('table.txt')

f = open(filename,'w')
f.write('0 3\n1 3\n5 1.2\n')
f.close()


# Plot the four datasets
#
# The kind of input is selected with the keyword arguments beginning
# with 'in_'.
#
# Specifying R=True and J=True results '-R' and '-J' being passed
# to the GMT program without any arguments. (Doing so causes GMT to
# repeat the previous values.)

gmt.psxy( R=True, J=True, W='1p,black', in_columns=data_as_columns )
gmt.psxy( R=True, J=True, W='1p,red',   in_rows=data_as_rows )
gmt.psxy( R=True, J=True, W='1p,blue',  in_string=data_as_string )
gmt.psxy( R=True, J=True, W='1p,purple,a', in_filename=filename )

gmt.save('example2.pdf')
Remarks
- Important: Appropriate appending of -O and -K is handled automatically.
- With in_columns and in_rows any iterable can be used. E.g. !NumPy arrays!
- See documentation of GMT.__getattr__() for details
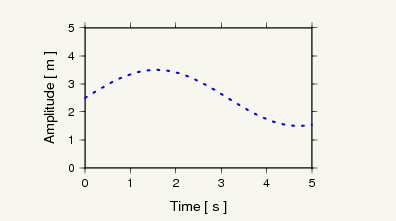
Example 3: Using default layouts
This example shows how to use a default layout to gain full control over the placement of a single plot on the output page.
Python code
from gmtpy import GMT, cm
import numpy as np

# Some data to plot...
x = np.linspace(0,5,101)
y = np.sin(x) + 2.5

gmt = GMT( config={'PAGE_COLOR':'247/247/240'} )

# Get a default layout for plotting.
# This produces a FrameLayout, a layout built of five widgets,
# a 'center' widget, surrounded by four widgets for the margins:
#
#          +---------------------------+
#          |             top           |
#          +---------------------------+
#          |      |            |       |
#          | left |   center   | right |
#          |      |            |       |
#          +---------------------------+
#          |           bottom          |
#          +---------------------------+

layout = gmt.default_layout()

# We will plot in the 'center' widget:
plot_widget = layout.get_widget('center')


# Set width of plot area to 8 cm and height of the 'top' margin
# to 1 cm. The other values are calculated automatically.
plot_widget.set_horizontal( 8*cm )
layout.get_widget('top').set_vertical( 1*cm )

# Define how the widget's output parameters are translated
# into -X, -Y and -J option arguments. (This could be skipped
# in this example, because the following templates
# are just the built-in defaults)
plot_widget['X'] = '-Xa%(xoffset)gp'
plot_widget['Y'] = '-Ya%(yoffset)gp'
plot_widget['J'] = '-JX%(width)gp/%(height)gp'

gmt.psbasemap( R=(0,5,0,5),
               B='%g:Time [ s ]:/%g:Amplitude [ m ]:SWne' % (1,1),
               *plot_widget.XYJ())

gmt.psxy( R=True,
          W='2p,blue,o',
          in_columns=(x,y),
          *plot_widget.XYJ() )

# Save the output, while replacing GMT's default bounding box
# with the exact box of the layout.
gmt.save('example3.pdf', bbox=layout.bbox())
Short version, only what is actually needed
from gmtpy import GMT, cm
import numpy as np

x = np.linspace(0,5,101)
y = np.sin(x) + 2.5

gmt = GMT( config={'PAGE_COLOR':'247/247/240'} )

layout = gmt.default_layout()
plot_widget = layout.get_widget('center')
plot_widget.set_horizontal( 8*cm )
layout.get_widget('top').set_vertical( 1*cm )

gmt.psbasemap( R=(0,5,0,5),
               B='%g:Time [ s ]:/%g:Amplitude [ m ]:SWne' % (1,1),
               *plot_widget.XYJ())

gmt.psxy( R=True,
          W='2p,blue,o',
          in_columns=(x,y),
          *plot_widget.XYJ() )

gmt.save('example3.pdf', bbox=layout.bbox())
Remarks
- The default layouts are tuned to the PAPER_MEDIA and PAGE_ORIENTATION gmtdefaults (man) variables. See the documentation for the GMT.default_layout() method for details.
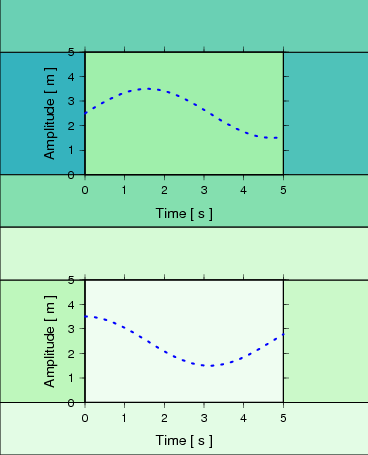
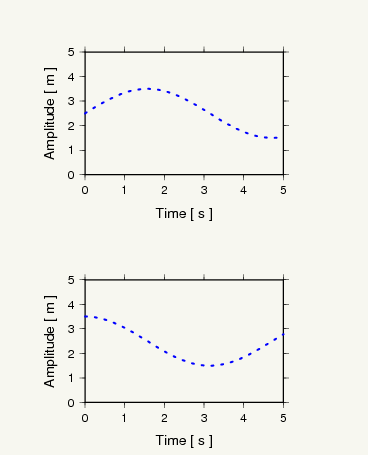
Example 4: Creating a custom layout
How to set up a custom layout to nicely place two plots on one page.
Python code
from gmtpy import GMT, cm, GridLayout, FrameLayout, golden_ratio
import numpy as np

# some data to plot...
x = np.linspace(0,5,101)
ys = (np.sin(x) + 2.5,  np.cos(x) + 2.5)

gmt = GMT( config={'PAGE_COLOR':'247/247/240'} )

layout = GridLayout(1,2)

widgets = []
for iwidget in range(2):
    inner_layout = FrameLayout()
    layout.set_widget(0, iwidget, inner_layout)
    widget = inner_layout.get_widget('center')
    widget.set_horizontal( 7*cm )
    widget.set_vertical( 7*cm/golden_ratio )
    widgets.append( widget )

# gmt.draw_layout( layout )
# print layout

for widget, y in zip(widgets, ys):
    gmt.psbasemap( R=(0,5,0,5),
                B='%g:Time [ s ]:/%g:Amplitude [ m ]:SWne' % (1,1),
                *widget.XYJ())

    gmt.psxy( R=True,
            W='2p,blue,o',
            in_columns=(x,y),
            *widget.XYJ() )

gmt.save('example4.pdf', bbox=layout.bbox())
Explanation
- Layouts may be arbitrarily nested. In this example two FrameLayout objects are placed in the widgets of a GridLayout.
- Three basic layout classes are available: FrameLayout, GridLayout and CenterLayout. See also documentation for Widget, from which they all inherit.
- The GridLayout.set_widget() method is used to insert the two FrameLayout objects into it.
- The layout hierarchy must be set up and configured completely first. After that, use it to place the plots.
How to debug the layout design
In the above example, uncommenting the line:
print layout
will print the sizes and positions of all widgets in the layout:
gmtpy.GridLayout (368.504 x 455.497) (0, 0)
  gmtpy.FrameLayout (368.504 x 227.749) (0, 227.749)
    gmtpy.Widget (85.0394 x 122.634) (0, 280.306)
    gmtpy.Widget (85.0394 x 122.634) (283.465, 280.306)
    gmtpy.Widget (368.504 x 52.5574) (0, 402.94)
    gmtpy.Widget (368.504 x 52.5574) (0, 227.749)
    gmtpy.Widget (198.425 x 122.634) (85.0394, 280.306)
  gmtpy.FrameLayout (368.504 x 227.749) (0, 0)
    gmtpy.Widget (85.0394 x 122.634) (0, 52.5574)
    gmtpy.Widget (85.0394 x 122.634) (283.465, 52.5574)
    gmtpy.Widget (368.504 x 52.5574) (0, 175.191)
    gmtpy.Widget (368.504 x 52.5574) (0, 0)
    gmtpy.Widget (198.425 x 122.634) (85.0394, 52.5574)
If you want to visually inspect the layout, you may additionally uncomment the line containing
gmt.draw_layout( layout )
The output graphics will then be underlaid by colored boxes, each representing one of the widgets in the layout: